Heatmaps and web analytics
One script tag records page views and heat. The map is drawn on your own live page, not on a screenshot of it.
Ask your agent
Paste this into your coding agent. It is the same prompt the Heatmap card hands out, and it works in anything that can read a file and run a command.
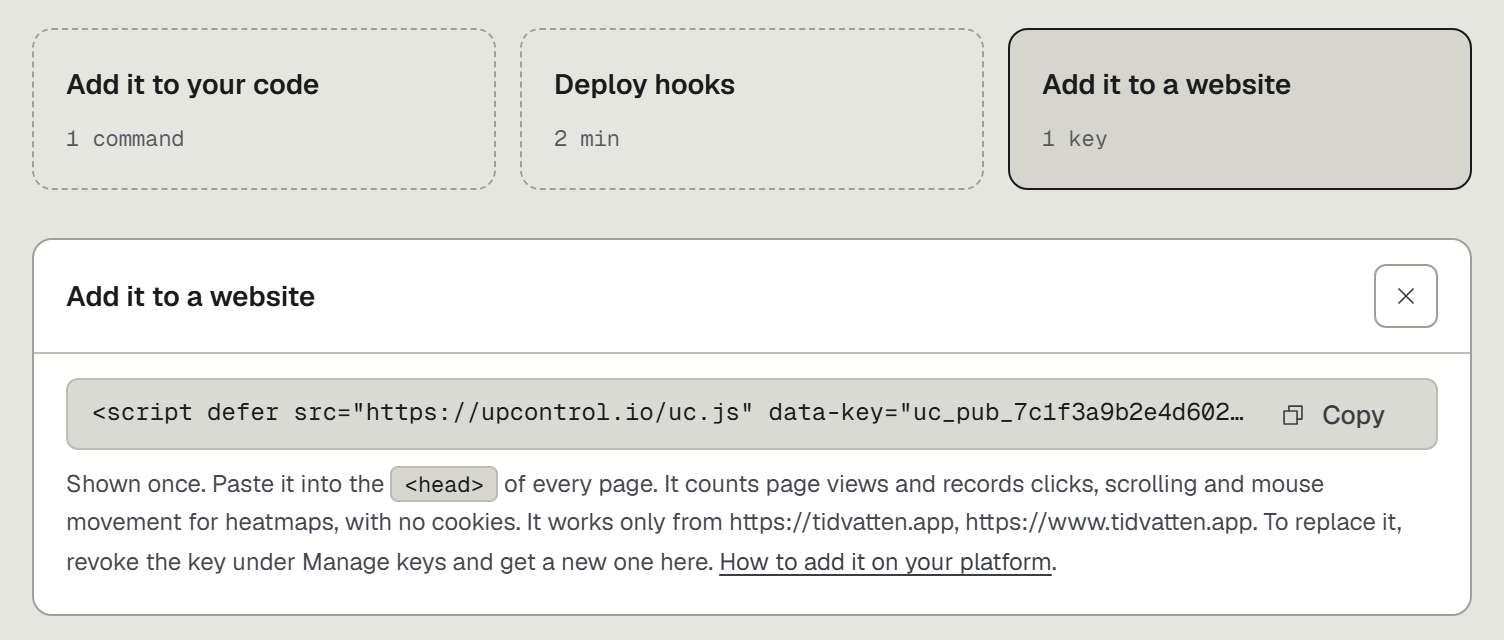
Add UpControl web analytics and heatmaps to this site. First read npx upcontrol skills web. Then run npx upcontrol (it saves this project's key to a gitignored .env without printing it). If it added @upcontrol/sdk to package.json, remove that line: the script tag does not use it. Then run npx upcontrol web <this site's public address> <its local dev address, for example http://localhost:3000>, naming both, because the key it mints works only on the addresses named in that first run. Put the script tag it prints inside the <head> of the layout every page shares, where the skill says for this framework. If the site has sign-in, mark members and anonymous visitors with a segment, as the skill says. When I have opened the site once, run npx upcontrol verify --web.Add the tag
- In the app, open
Connectand pressAdd it to a website. Or run the command below. - Name every address the site is served from. The key works on those origins only, matched exactly, no wildcards, so add your dev address if you want dev traffic too.
- Paste the tag it prints into the
<head>of the layout every page shares. - Load the site once, then run
npx upcontrol verify --web.
npx upcontrol web https://example.com http://localhost:3000
Both doors print the same tag:
<script defer src="https://upcontrol.io/uc.js" data-key="uc_pub_..."></script>
The key in it is public and belongs in the page. It writes page views and heat, nothing else, and only from the addresses you named.
Read the map
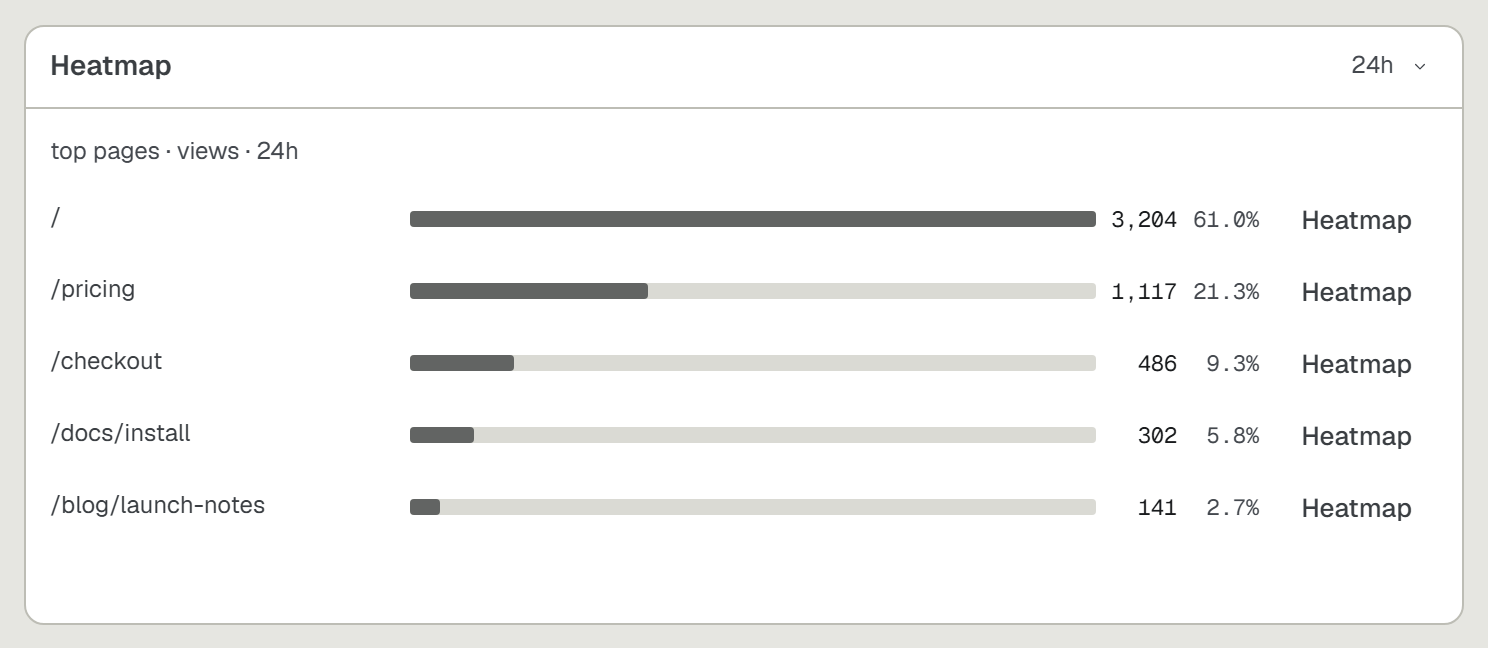
Add a Heatmap card to your dashboard: Add widget, then Heatmap. It lists your busiest pages, and each row opens that page with its map drawn over it through a link good for one hour. Beside its views each page carries its engaged time and its rage and dead clicks per 100 views, and a Stat, Line or Bar card draws Engaged time per view from the Website group.
Clicks,Rage,Dead,Moves,ScrollandFormseach toggle a layer, and layers stack.Formsbadges each field with the share of views that focused and filled it, the field people most often left from, and the share that submitted the form. Switching tabs mid-form is not leaving; closing the page is.Rageis where somebody clicked three or more times inside 700ms and 24px: a dead button, a slow one, or something that looks clickable and is not.Deadis where a click landed on something that is not a control and nothing on the page changed after it: text that reads like a link, an image that looks like a button.- Hover an element to read its numbers: the views that clicked it and their share of all views, its clicks, rage clicks and dead clicks. A control nobody pressed says
No clicks. Scrolldraws how far down the page each visitor reached, and hovering it reads the share of views that got that deep.- The range select reads back as far as your plan keeps, up to 31 days.
Comparepicks one of your recent deploys and draws what changed: warm where clicks per view grew, cool where they shrank, and hovering saysCTR 9% -> 12%. Day by day inside the last week, week by week before it.- A map belongs to one device bucket, taken from the window width: phones below 768px, tablets below 1024px, desktops above. Narrow the window to read the phone map.
- The Segment select reads the map of one kind of visitor the site marked, and the Source select one kind of visit: search, social, campaign, referral or direct.
- Drag the panel by its header, close it with the cross.
Members and newcomers
The script keeps nothing on the device, so it cannot tell a member from a stranger, or new from returning. Your site can: mark the visitor with a segment, on the tag when the page is rendered with the session known,
<script defer src="https://upcontrol.io/uc.js" data-key="uc_pub_..." data-segment="member"></script>
or from your app once it knows, and again on sign-in and sign-out:
window.upcontrol = window.upcontrol || function () { (upcontrol.q = upcontrol.q || []).push(arguments) };upcontrol('segment', user ? 'member' : 'anon');
- A segment is 1 to 24 of a-z, 0-9, _ and -. Never an id, an email or a name: four digits in a row are refused.
- Declare the names first, at most four: in the app under Connect, on the website card, or with
npx upcontrol web <site> --segments member,anon. Only a declared name is recorded and any other is ignored, so a page holding the public key cannot invent one. Pick them on purpose:member,anon,trial,newfor an account younger than a week. - A segment set while a page is open applies from the next page view: the view in progress keeps the one it started with.
- The source of a visit is worked out by the script from the referrer and the UTM tags of its first page, and needs nothing from you. A later page of a multi-page site has no source, because keeping it would mean storing it on the device.
- To credit a signup to a campaign, have the form carry
upcontrol('source') || {}to your backend: it returns the visit's source, UTM tags and landing page, and before the script has loaded it returns nothing.
What it records
- A page view on load and on every SPA path change, carrying the path, the referrer host, UTM tags, the country, the device bucket, the browser and the OS.
- Clicks, rage clicks, mouse movement (only on pointers that can hover) and scroll depth.
- A click is addressed to its element by id or
:nth-of-type, never by class name, at a position in 64ths of that element box. The map survives a responsive layout and a rebuild that renames classes. - Heat is added up in the page and sent once per page view, not once per click.
- Engaged time per page view: the seconds the tab was visible and somebody had moved, typed, clicked or scrolled within the last 30. It goes idle after 30 seconds without input, counts at most 30 minutes a view, and rides with the heat, so it costs no extra request.
- Which elements a view clicked at least once, so the map can say what share of views clicked each one, not only how many clicks it took.
- Dead clicks: a click on something that is not a control, after which nothing on the page changed.
- Forms: which fields a view focused and filled, which form it submitted, and the field it left the page from without submitting. Never what was typed, how long it was, or anything derived from it.
- Events you name: a click on an element carrying
data-uc-event="cta_click", orupcontrol('track', 'cta_click')from code. They share the page view's visitor, so a funnel from a page to the click counts the same people within a day.
And what it never does:
- No cookie, no local storage, nothing kept on the device.
- A visitor is a hash of the address and the browser under a salt that changes every day, so nobody can be followed into tomorrow.
- Page views never enter your log window, so they cannot push your own logs out of it.
Limits
- Visits per workspace per month, and how many pages keep a heatmap: your busiest ones, by views.
- A visit is one visitor on one day, however many pages they open.
- Past the month allowance the tag keeps answering and nothing new is stored until the month turns, so a spike never breaks the site.
- Heat is kept 31 days at most, and less on plans with a shorter history.
The numbers per plan are on the pricing page, and your own month so far is on your plan screen.