Google Analytics alternative: page views and heatmaps from one script tag, no cookies
2 min read · published 2026-10-13
The pitch
Google Analytics 4 is free and goes deep on acquisition and ads. Many small sites open it to answer simpler questions: how many people came, from where, and what did they do on the page. This post is for those sites.
| Google Analytics 4 | UpControl | |
|---|---|---|
| Price | Free | Free up to 3,000 visits a month, paid plans from $9/month annual |
| Cookies | Yes | None: no cookie, no local storage |
| Page views | Yes | Yes, with referrer, UTM tags, country, device, browser and OS |
| Heatmaps | No | Clicks, rage clicks, moves and scroll on your live page |
| Ads and attribution | Deep, tied to Google Ads | UTM tags only |
| Uptime checks and logs in the same tool | No | Yes |
| Self-hosting | No | Yes, AGPL-3.0 |
Where UpControl is better
- No cookie and nothing stored on the device. A visitor is a hash that changes every day, so nobody is followed into tomorrow.
- Heatmaps are included. Clicks, rage clicks, mouse movement and scroll depth are drawn over your own live page, one map per device size.
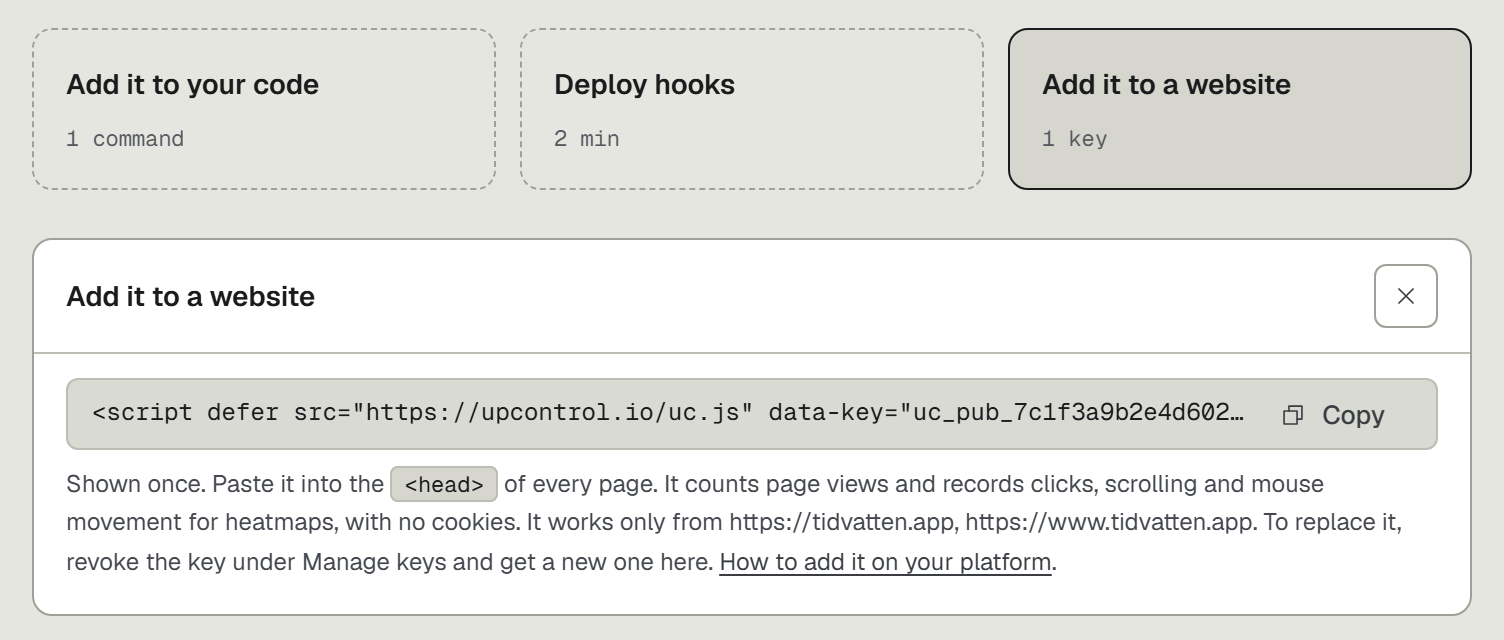
- One tag and nothing to configure. A page view arrives on load and on every route change of a single-page app.
- It sits next to your uptime checks and logs. A drop in visits and the outage that caused it are in one place.
Where Google Analytics is better
- It is free at traffic far beyond a small site's. UpControl counts visits per plan: 3,000 a month on Free, 30,000 on Indie, 150,000 on Growth, 300,000 on Agency. Past the allowance nothing new is stored until the month turns.
- Advertising. Attribution, audiences and the link to Google Ads have no equivalent here.
- History. Heat is kept 31 days at most, and heatmaps cover your busiest pages only: 5 on Free, up to 100 on Agency.
- Everyone already knows it, and most tools plug into it.
Add it next to Google Analytics
- Run
npx upcontrol web https://example.comwith your own address, or open Connect in the app and pressAdd it to a website. - Paste the tag it prints into the head of the layout every page shares.
- Load the site once, then run
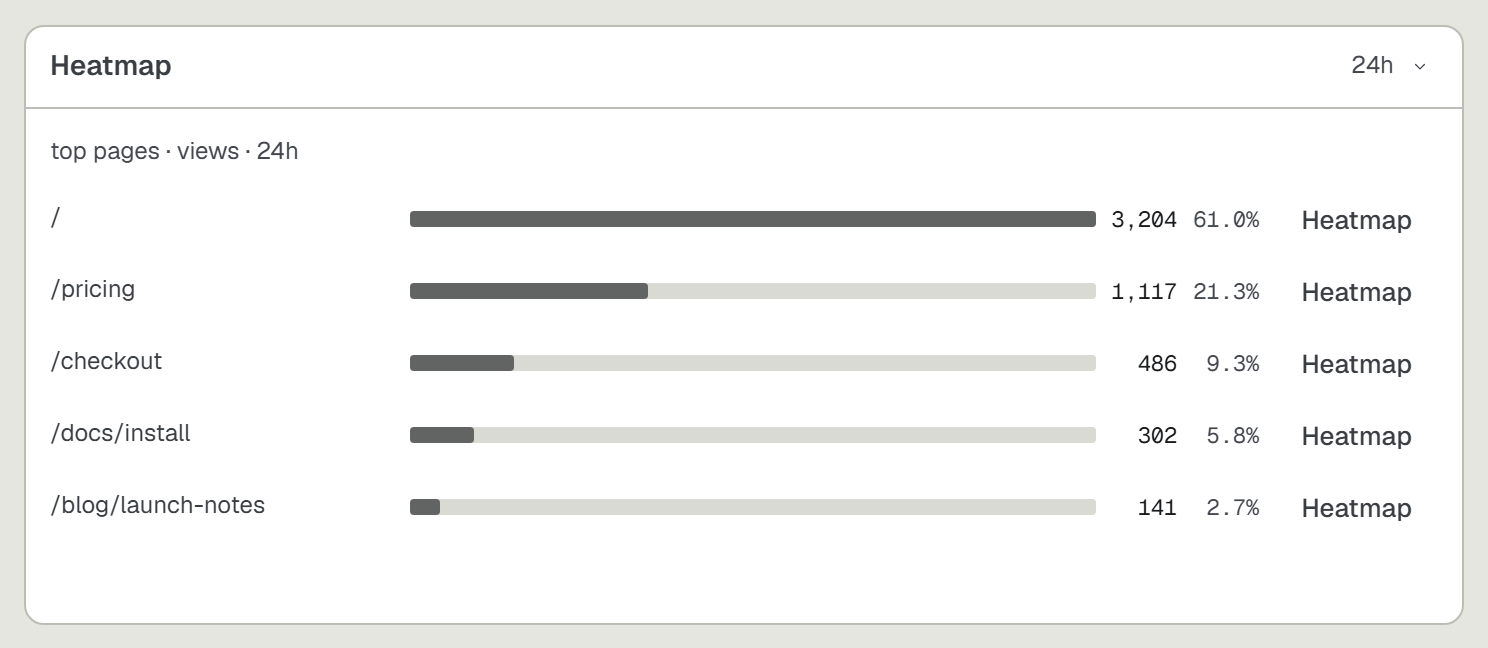
npx upcontrol verify --web. - Add a Heatmap card to your dashboard. Each row opens that page with its map drawn over it.