Heartbeat monitoring without code
4 min read · published 2026-10-14
The short version
Most monitoring tools ship an SDK and a config file, and the heartbeat is no exception: install the client, initialize it, add the call, deploy. It works, but the wiring lands on you, and the evening a second job needs watching it lands on you again. There is a lighter path. A heartbeat is one plain HTTP request from the end of your job, no library needed, and the part that normally takes the evening, wiring it into the job, can be handed to the coding agent you already use. Heartbeats are free on every UpControl plan and never count toward the check limit.
| Heartbeats | |
|---|---|
| Cost | free, on every plan |
| Counts toward the check limit | never |
| Cadences | every 5 or 30 minutes, hourly, every 6 hours, daily |
| When the alert fires | a missed ping opens an incident at most an hour past its due time |
| Where alerts go | Telegram, Slack, Discord, email, unlimited |
| What you write by hand | nothing; one line the agent adds, or a curl if you prefer |
| Self-hosting | the full core is AGPL-3.0, one compose file, 1GB RAM box is enough |
What "without code" means, honestly
A heartbeat cannot be zero-code in the strict sense: the job has to send something, or the monitor has nothing to wait for. What can be zero is your part in it.
The wire is one HTTP GET from the end of the job. No SDK, no client library, no build step: any language that can make one web request can send it, which covers every language running on a schedule. The monitor holds the schedule, so the request carries no timing logic either. If the request arrives, the job finished. If it does not, that is the alert.
So the honest claim is not "no code exists". It is "no monitoring code is yours to write". Two things follow from that, and both are worth saying out loud:
- No client to keep current. An SDK in a background worker is a dependency you upgrade on a Saturday, or silently stop upgrading.
- No instrumentation to forget. One curl line at the end of the job is the entire footprint. If it is there, it works.
The part you would normally do yourself
The conventional setup is a dashboard flow: create the heartbeat, copy a long URL, open the worker's code, paste the call in the right place, guess the cadence, deploy, wait for the first ping. Every job repeats it.
The agent-first path moves that step. You run npx upcontrol in the repo, it hands the wiring to the coding agent you already use (Claude Code, Cursor, Codex, Gemini CLI, Copilot, Windsurf, Amp, Aider, Cline, opencode), and you ask in plain words: "watch the nightly export job with a heartbeat". The agent reads the schedule out of the crontab or the worker config, creates the heartbeat at the matching cadence, adds the one line, and the first ping is on its way at the next run. No tracking code written by hand.
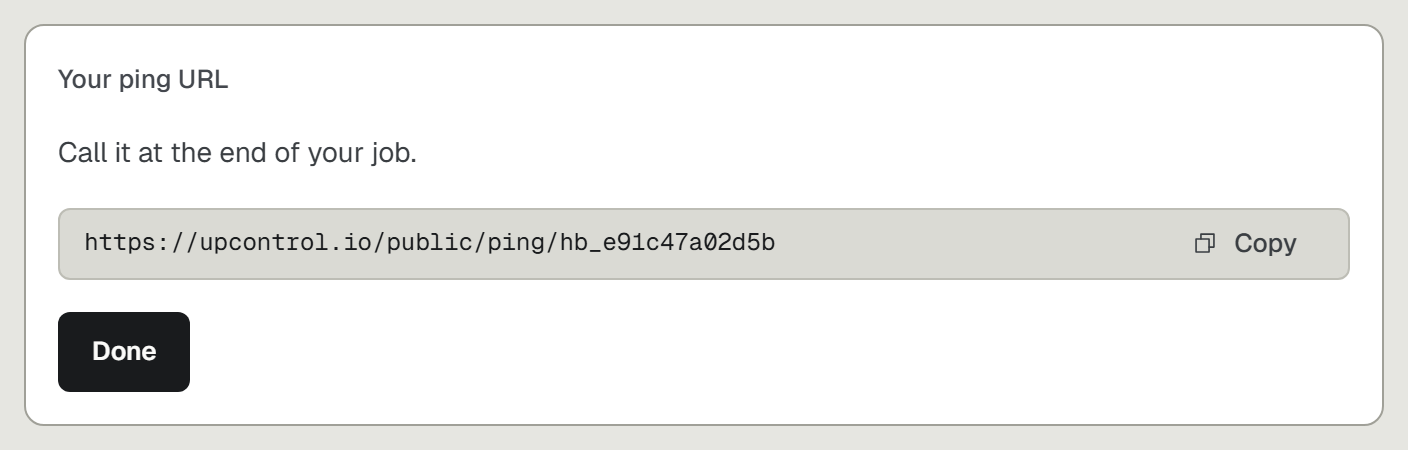
The plain request underneath does not go away, and that is deliberate. If you would rather wire it yourself, the same ping URL takes one curl in a shell script, one fetch in Node, one Invoke-WebRequest in a scheduled task. The agent is a shortcut over a simple wire, not a private one.
Picking the cadence
- Every 5 or 30 minutes: queue drainers, pollers, anything that runs more often than hourly.
- Hourly: sync jobs and digest builders.
- Every 6 hours: cache refreshes, batch exports.
- Daily: backups, rollups, cleanup. Nightly jobs are the classic case, and they are covered.
Match the heartbeat to the schedule, not tighter. A daily job with a 5-minute heartbeat alarms between runs. A monitor expecting exactly what the job does is the whole trick.
One honest limit on speed: a missed ping is caught at most an hour past its due time. That is fine for backups and exports. If a job failing in seconds must be known in seconds, the job needs its own error path, and log alerts are the better door: UpControl alerts on new errors in your application logs on every plan, paid plans add a 15-minute follow-up that says whether the job recovered or is still down.
When the ping stops arriving
The heartbeat says a job did not finish. The useful next question is what it was doing when it stopped. UpControl correlates checks, logs and product events, so the incident page for a missed ping carries the log lines around the failure and the deploy that landed before it, not only "did not run since 03:00". The same npx upcontrol wires the logging, so the job's output lands in the same timeline as its heartbeat, the website checks and the deploys.
Test it once before you trust it: comment the ping out, let the due time pass, watch the incident open and land in Telegram, Slack, Discord or email. Uncomment, watch it resolve. Two minutes, and you know the chain works end to end.
The honest limits
- No phone or SMS escalation, no on-call rotations. Telegram, Slack, Discord and email is the whole channel list.
- The catch latency above: up to an hour past the due time, not seconds.
- UpControl is a younger product with fewer integrations than the decade-old incumbents. Heartbeats, logs and alerts cover the scheduled-job case; a large existing toolchain may miss a connector it relied on elsewhere.
- Website checks are a separate budget, 3 on the free plan, counted workspace-wide. Heartbeats never touch that count.
- If the jobs run somewhere you would rather not send pings from, the whole core is AGPL-3.0 and self-hosts from one compose file on a 1GB box, with zero telemetry in the OSS build.
One npx command and the agent does the wiring: [start with npx upcontrol](https://upcontrol.io/?utm_source=blog&utm_medium=vs&utm_campaign=engine).