SaaS metrics: what to track on a small product, and what to ignore
5 min read · published 2026-10-24
The short list
Every SaaS metrics list has forty rows and assumes a finance team. On a five-person product you need five numbers, each wireable in an afternoon, and the honesty to skip the ones your volume cannot support yet. This is the short list, what each needs on the wire, and where dedicated tools go further.
- Activation. Of the people who signed up, how many reached the real use of the product. Everything downstream inherits this number, and it is the one a landing page cannot fix for you.
- Retention, weekly. One row per cohort of signups, one column per week since. Whether people come back is the fact no topline graph can stand in for.
- Paid conversion. Free users or trials turning into payers. It is the last step of the same funnel, not a separate dashboard.
- Churn, counted by people. A cancelled subscription is an event like any other. Count who left and, if you capture a reason, fold by it; percentages of a base small enough to swing on one account read more precise than they are.
- One A/B test where money moves. Pricing page copy or the checkout button. One event, one variant, an answer you act on.
- Revenue, read where it lives. MRR is a billing-tool number. Stripe or Paddle already computes it; rebuild it from product events and you will end up trusting the wrong copy of it.
What each one needs on the wire
Product events carry three things: a name, that it is an event, and who did it. Every metric above is one fold over that. Send honest events once, read them several ways. A Node SDK exists, and a sender in Go, Rust or the browser writes the same one-line JSON to the same wire.
| The metric | Events on the wire | The card that reads it |
|---|---|---|
| Activation | signup, then the event that is real use in your product | Funnel, two to twelve steps |
| Retention | signup, plus the events a returning person produces | Retention grid, weekly cohorts |
| Paid conversion | checkout started, paid | the same funnel, last steps |
| Churn | subscription cancelled, with the person and a reason field | Breakdown, folded by that field |
| The pricing test | your conversion event, with its variant | A/B test, control arm first |
What it looks like here
npx upcontrol in the repo hands the setup to the coding agent you already use; ten are supported, among them Claude Code, Cursor and Codex. You ask in plain language, "track my users from first visit to purchase", and the agent wires the events with your users as the actors. No tracking code written by hand.
The cards are built from events the project has already received, on the same boards as your uptime checks and logs. Funnel bars count distinct people once, whatever their refresh count, and the order is your claim, not an enforced sequence: a person counts at a step if they have that event at all, so a later bar can read higher than an earlier one, people arriving by another door. Stated out loud beats quietly dropped.
Two rules of the wire worth knowing before your first card. Prefix your user ids (u_1042, not 1042): a bare 13 to 19 digit number is scrubbed as a card number, and an event with no actor on it never counts in a people read. And how far back the boards read is the plan axis, from the pricing page as of 2026-10: 1 day on Free, 7 on Indie, 31 on Growth, 365 on Agency.
Where dedicated tools still win
- Session recordings and replays. We record clicks, rage clicks, moves and scroll for heatmaps, and nothing that replays a session. Tools built for analytics alone carry both.
- Years of depth and the digging that comes with it: paths, notebooks, cohort explorations. Our boards read back at most 365 days on the largest plan, and web analytics reaches 31 days at most.
- Ad attribution beyond UTM tags, and the integration catalogue of a decade-old incumbent. Younger product, fewer integrations; that is the trade.
Wire it in five minutes
- Run npx upcontrol in the repo. Tell the agent the journey in plain words: "track my users from first visit to purchase." It writes the events with your user ids as the actors.
- Add what the short list needs beyond the journey: subscription cancelled with its reason field, and the variant on your pricing test, sent with the conversion event.
- Open the dashboard, press Add widget, and pick Funnel, Retention, Breakdown or A/B test. Press your events in order, name the card.
- Read the sharpest drop first. That gap, with the log lines and the deploy beside it when the cause was yours, is where the next fix is.
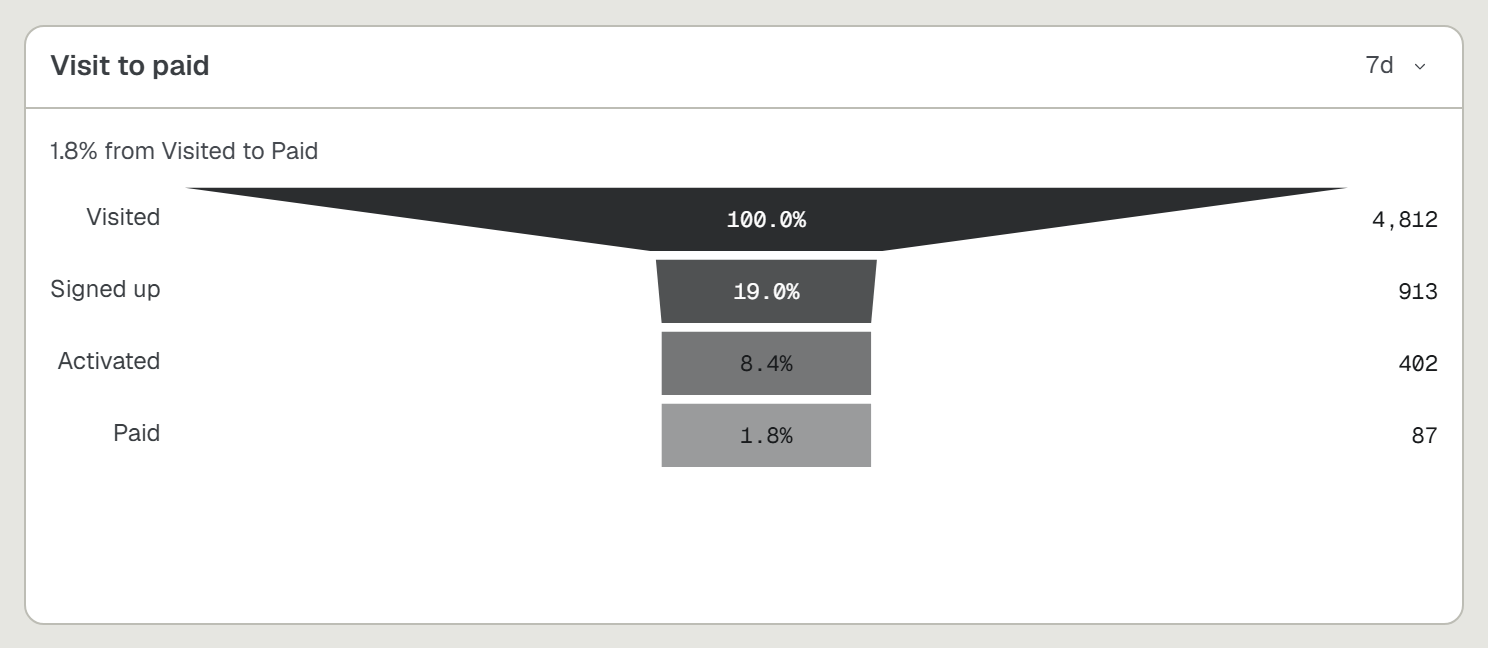
The five numbers that matter, wired by the agent you already have: https://upcontrol.io/?utm_source=blog&utm_medium=vs&utm_campaign=engine